We Love OSS!
To get the best value, we use open-source software crafted and customized for your top experience. You don’t pay any money for the development. You just consume what you need!
Telegraf as an Agent
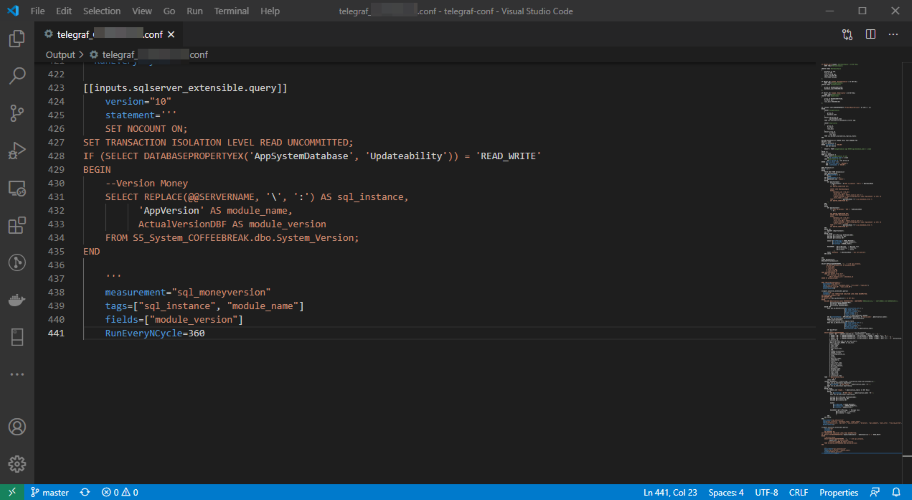
Placed on your server or hosted in our container, we use Telegraf as an agent to gather the performance data from your SQL Server & operating system. In need of additional data? No problem – we have customizable scripts
and plugins, which cover not only the performance but also your business data!

InfluxDB as the Backend
All the billions of rows we gather, we securely store inside the InfluxDB time-series database allowing processing of millions of rows per second. Concerned about your data leaving your DC? No problem – we can run InfluxDB
in your environment!
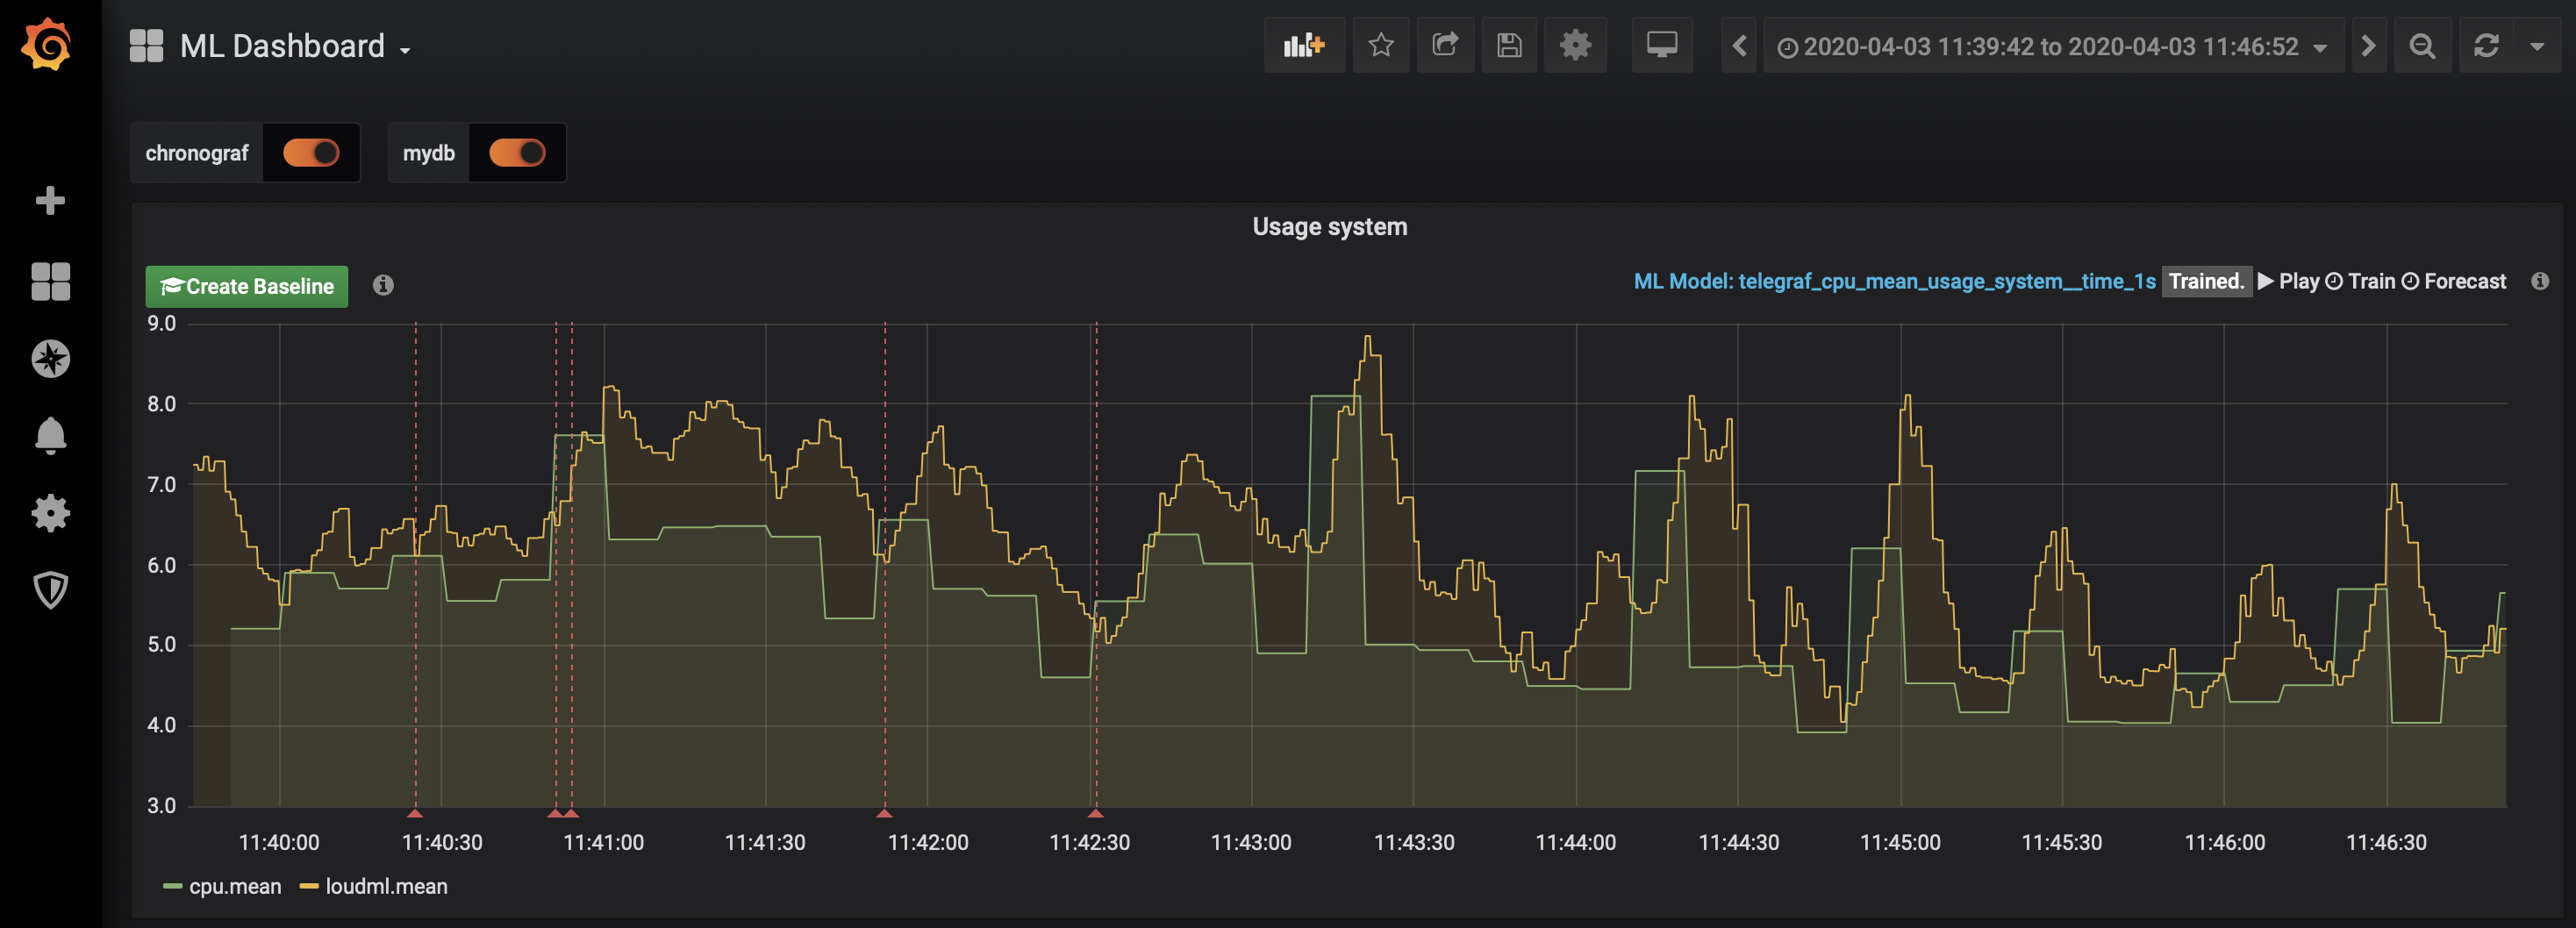
Grafana as the Visualization
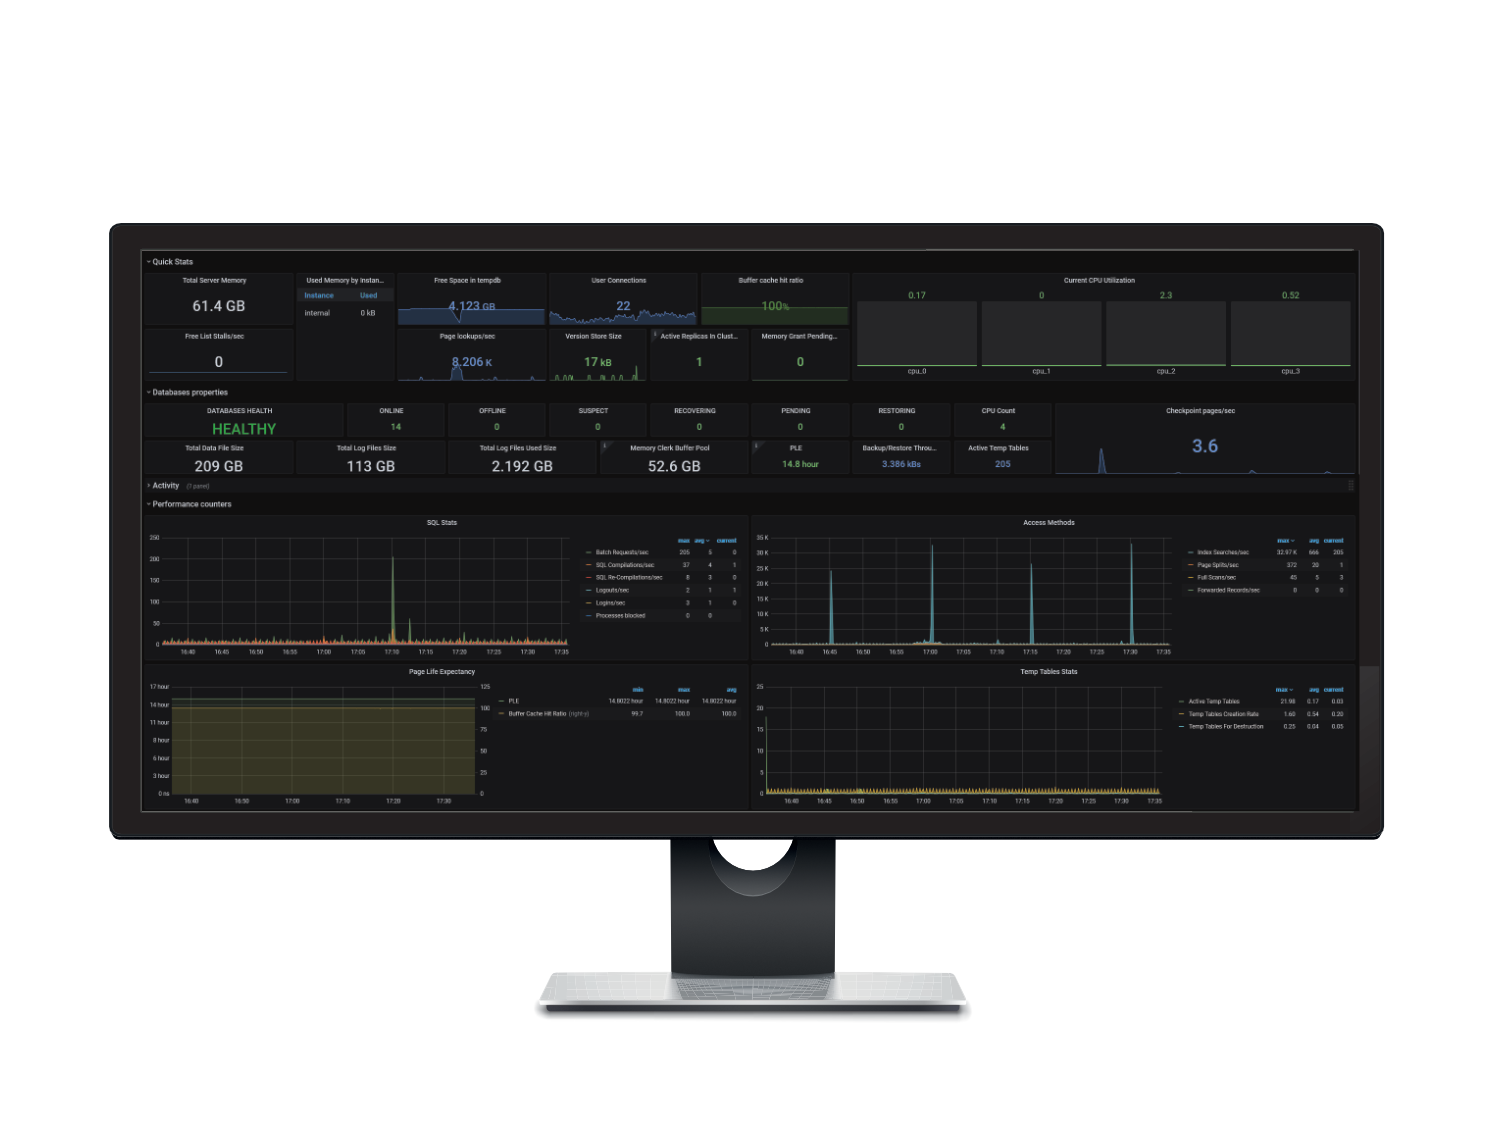
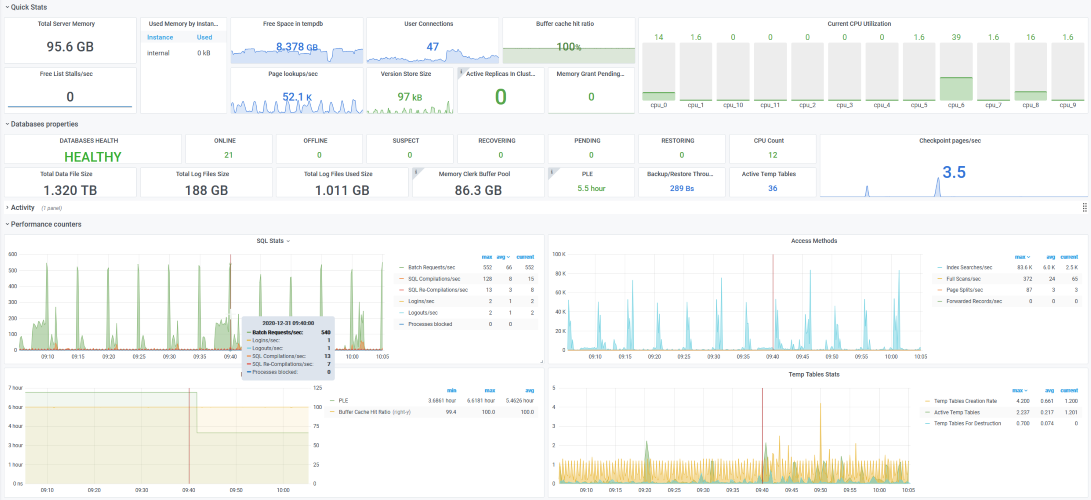
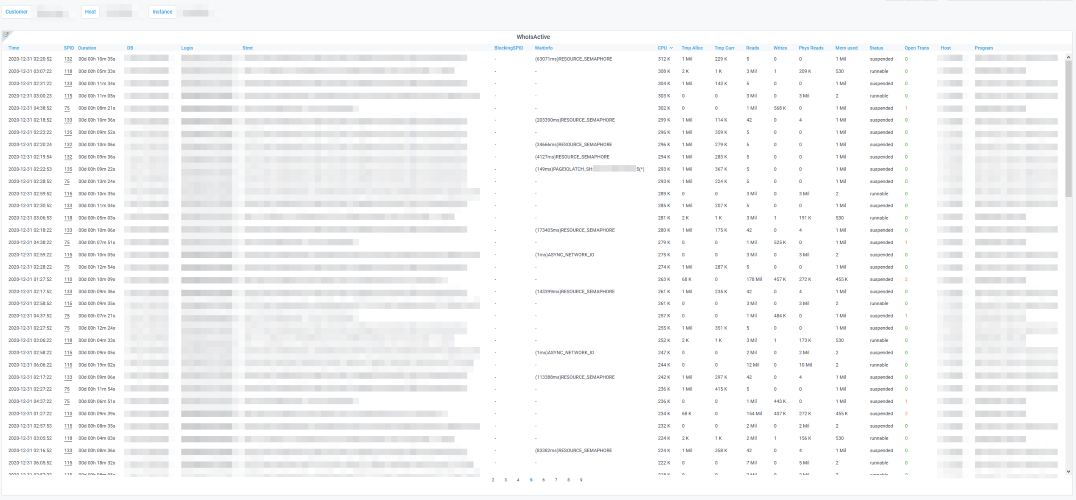
We use Grafana to visualize & analyze your data. Our dashboards can be easily enriched by your custom data so we can correlate anything you need.
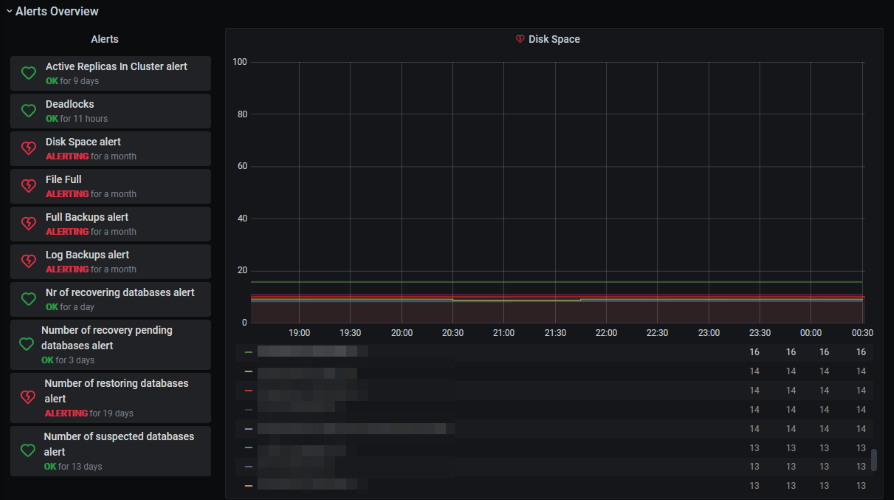
In case of any events, the alerting engine is ready to notify us or you 24×7.

See Some Basic Features

Want to know more? … You can!
We love sharing our knowledge – check our demo or go through the conference presentation!

